
Netdata
Real-time infrastructure monitoring platform
Alternative to: grafana, prometheus, zabbix, datadog
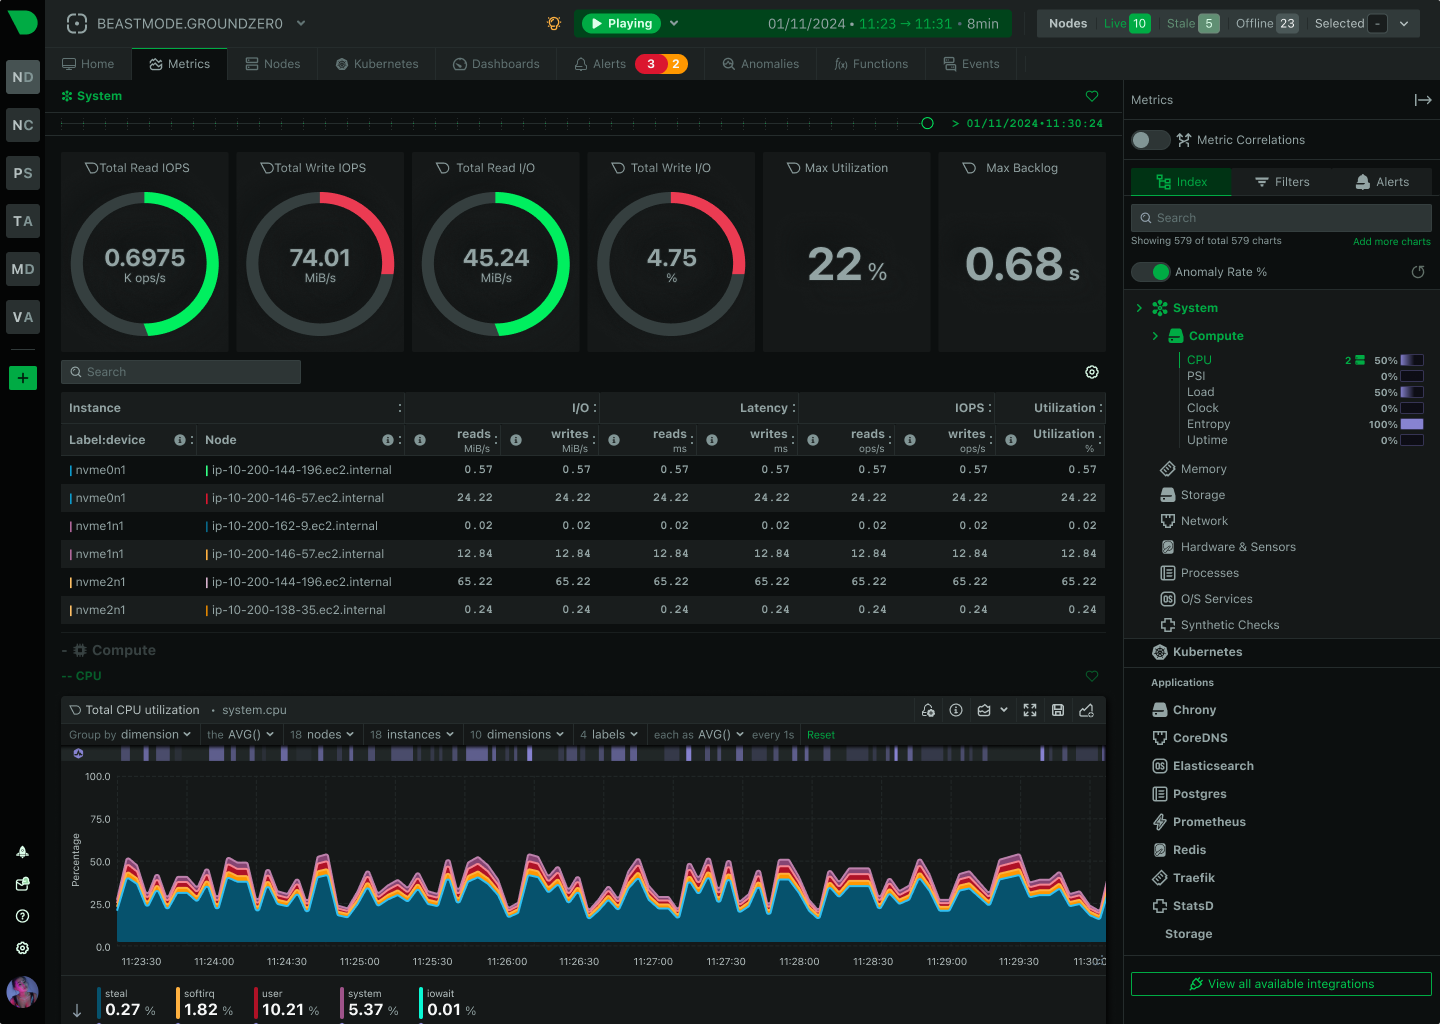
Screenshots
Details
Support this project
vv2.7.0
2025-09-25Netdata v2.7.0 adds AI insights, chart annotations, data export, stable SNMP profiles, and improved IP detection.
Table of Contents
Release Summary
Netdata v2.7.0 introduces powerful new capabilities and continues our commitment to stability with significant improvements to system robustness. This release contains numerous under-the-hood improvements aimed at making Netdata more reliable in production.
| Highlight | Summary |
|---|---|
| Netdata AI | Automated troubleshooting, on-demand analysis, scheduled infrastructure reports and more. |
| Chart Annotations | Create shared annotations on any chart to mark deployments, incidents, or other key events for your team. |
| Quick Data Export | Export data from any chart, table, or log view to various formats (CSV, PNG, PDF) for offline analysis. |
| OpenTelemetry (Alpha) | New otel.plugin ingests metrics via OTLP gRPC and maps them into Netdata charts. Experimental and evolving. |
| SNMP Profiles Stable | Profiles are now stable and the default method, with improved metadata (~15k entries) and better coverage. |
| Default IP Detection | Nodes are now displayed as NodeName (IP), making it easier to identify and filter systems by IP. |
| Stability Improvements | Contains fixes to eliminate potential crashes and resolve memory issues. |
Release Highlights
Introducing Netdata AI: Your Co-SRE for Automated Analysis
Netdata AI is a step-change in how teams work with infrastructure observability data. Above and beyond visualizing all your metrics in beautiful real time charts, Netdata AI synthesizes your per-second metrics into clear explanations, timelines, and actionable reports. It’s designed to automate the heavy lifting of troubleshooting and analysis for you.
Key Capabilities:
- AI Insights: Generate on-demand reports for common SRE tasks like performance optimization, capacity planning, and weekly infrastructure summaries.
- Automated Investigations: Run open-ended investigations and explorations or just ask questions in plain English (e.g., “Why are my Kubernetes pods in us-east-1 crashing?”) and get a detailed, evidence-backed report in minutes.
- Alert Troubleshooting: Get a root-cause analysis for any active alert with a single click.
- Scheduled Reports: Automate your reporting by scheduling any investigation, like a weekly health check or a monthly performance analysis, to run automatically.
- Share & Export: Download any AI report as a professional PDF for offline sharing, or share it directly with teammates via email from within the Netdata Cloud UI.
How to use it: Visit the “AI Insights” tab, or interact with Ask AI and/or “Troubleshoot” buttons throughout Netdata Cloud. All users on Trial, Business and Homelab plans have access to 10 free AI sessions. Further sessions can be purchased in-app. If you are on the community plan and would like to try out Netdata AI, please sign up to the waitlist.
Chart Annotations: Mark and Share Key Events
You can now create annotations directly on any Netdata chart to mark and share important context with your team.
How to use it: Simply click on any chart at the desired timestamp to add a note and a color-coded marker. This marker will be visible to your entire team, providing a shared timeline of events.
Common Use Cases:
- 📌 Mark Deployments: Pinpoint the exact time a new software version was released.
- 🔥 Log Incidents: Mark the start and end times of an incident for easier post-mortems.
- ⚙️ Track Changes: Note when a critical configuration change was applied.
- 💬 Add Context: Leave notes for teammates to explain a specific anomaly or trend.
Quick Data Export
We’ve added comprehensive data export capabilities directly within the Netdata Cloud Dashboards, allowing you to take your data offline for custom reporting, further analysis, or sharing.
What you can export:
- From Charts: Download the data visualized in any chart as a CSV, raw data file, PNG image, or PDF document.
- From Tables & Logs: Export the data from any table—including in the Logs, Events, and Alerts tabs—as a CSV file.
How to use it: Look for the download icon on any chart or table to access the new export options.
OpenTelemetry Metrics Ingestion (Alpha)
The new otel.plugin enables Netdata to ingest metrics from the OpenTelemetry ecosystem. It lets you bring in metrics from services and apps already instrumented with OpenTelemetry, unifying them with the high-resolution system metrics that Netdata provides. No extra exporters required. This is an early-stage feature, so configuration and custom mappings are still experimental and may change.
[!IMPORTANT] As an alpha release, expect rapid improvements and possible configuration changes in future versions.
What’s Inside
| Capability | Details |
|---|---|
| OTLP gRPC Endpoint | Listens on port 4317 for incoming metrics |
| Flexible Sources | Works with an OpenTelemetry Collector or directly from apps |
| Automatic Mapping | Transforms OTel metrics into Netdata charts with minimal setup |
| Alpha Status | Early stage, limited docs, experimental configuration, subject to change |
SNMP Monitoring with Device Profiles: Now Stable
Introduced as alpha in v2.6.0, SNMP profile-based collection has now matured into the default and recommended method for SNMP monitoring in Netdata. The old custom OID method is deprecated and disabled by default.
What’s New
| Improvement | Details |
|---|---|
| Better Device Metadata | Accurate vendor, model, and category detection with new metadata files, including ~15,000 entries across major vendors (Cisco, Juniper, Huawei, D-Link, Aruba, Arista, Allied, and more) |
| Improved Profiles | Enhanced and more complete SNMP profiles for a smoother experience |
| Bug Fixes | All known issues resolved |
What You Get
- Reliable device identification (Router, Switch, Firewall, etc.) without manual setup
- Automatic vendor and model recognition across a wide range of devices
- A reliable and stable monitoring method that is now the default
[!TIP] We’re continuing to expand coverage based on user feedback. Missing metrics for your devices? Let us know!
Default Network Interface IP Detection
Netdata now automatically detects the IP address of the network interface on the default route across Linux, macOS, Windows, and BSD. This makes it easier to quickly match nodes in Netdata with the IPs administrators use day-to-day.
What’s Inside
| Capability | Details |
|---|---|
| Cross-Platform Support | Works on Linux, macOS, Windows, and BSD |
| Automatic IP Detection | Finds the IP of the network interface used for the default route |
| Enhanced Node Names | Nodes are displayed as NodeName (IP) in the UI |
| Faster Filtering | Search or filter nodes by IP address in the node selector |
Acknowledgments
- @BenjaminFosters for fixing DNF5 support in kickstart
- @rons4 for adding SIGNL4 alert notification method to Netdata Agent
- @gatesry for fixing opt-out link in ‘Security and Privacy Design’
- @emmanuel-ferdman for fixing a bug in MCP web client app
- @andrewm4894 for fixing link to Netdata Cloud Demo Space
Contributions
Collectors
Improvements
- Improved cgroups collector by skipping KubeVirt helper containers in virt-launcher pods (cgroups.plugin) (#20896, @ilyam8)
- Added sensor metrics collection (temperature, power, current, humidity, lux) (windows.plugin) (#20840, @thiagoftsm)
- Added various improvements to SNMP profiles and go.d/snmp collector ( go.d/snmp) (#20819, #20828, #20867, #20878, #20879, #20882, #20883, #20884, #20885, #20888, #20889, #20895, #20898, #20957, #20958, #20959, #20960, #20962, #20964, #20970, #20971, #20972, #20979, #21013, #21014, #21017, #21022, #21023, #21026, #21039, @ilyam8)
- Improved ZFS pool collector by adding the Ubuntu-specific zpool binary path to the configuration (go.d/zfspool) (#20806, @ilyam8)
- Added more MSSQL metrics (windows.plugin) (#20788, @thiagoftsm)
- Added OpenTelemetry plugin implementation (otel.plugin) (#20765, @vkalintiris)
- Enabled services collector by default (windows.plugin) (#20720, @thiagoftsm)
Bug Fixes
- Switched to a forked gosnmp library to fix SNMPv3 authentication issues with UniFi APs (go.d/snmp) (#21009, @ilyam8)
- Fixed weblog dynamic config by removing invalid path pattern validation to support Windows paths (go.d/weblog) (#20923, @ilyam8)
- Fixed a race condition in Docker exec that could cause goroutine leaks and panics (go.d/pkg/dockerhost) (#20881, @ilyam8)
- Fixed MSSQL charts that were showing zero values due to inaccurate Perflib results (windows.plugin) (#20774, @thiagoftsm)
Other
- Fixed go.d to skip writing HOST lines for vnodes without collected metrics (go.d.plugin) (#20995, #20996, #21008, @ilyam8)
- Cleaned up go.d/pkgs logs with validation fixes and improved resource handling (go.d.plugin) (#20931, @ilyam8)
- Removed unused hostname resolution functionality (go.d.plugin) (#20922, @ilyam8)
- Added build-time configuration directory paths (go.d.plugin) (#20913, @ilyam8)
- Moved vnode data collection status charts to the main context (go.d.plugin) (#20872, @ilyam8)
- Renamed the default port label opencensus-nodejs_prometheus_exporter to otelcol (go.d/sd) (#20868, @ralphm)
- Moved nd directories to dedicated pluginconfig package (go.d.plugin) (#20827, #20912, @ilyam8)
- Improved MSSQL collector shutdown by adding an optional cleanup hook to release resources and stop helper threads (windows.plugin) (#20725, @stelfrag)
- Changed how MSSQL connections and queries are handled to improve runtime performance (windows.plugin) (#20677, #20892, @thiagoftsm)
Packaging/Installation
All changes
- Fixed netdata-updater offline installs by resolving the “run: command not found” error. (#20915, @ilyam8)
- Updated libbpf to 1.6.2 (#20875, @thiagoftsm)
- Fixed DNF detection in the kickstart script to support DNF5 (#20823, @BenjaminFosters)
- Switched Docker images to use Debian 13 as the base (#20816, @Ferroin)
Documentation
All changes
- Fixed broken links and FAQ format in scalability.md (#21030, #21032 @kanelatechnical)
- Improved Netdata API documentation (#21027, @kanelatechnical)
- Rename ‘Top Monitoring’ to ‘Top Consumers’ in Functions documentation (#21019, #21020 @ktsaou)
- Added comprehensive scalability architecture documentation (#21018, @ktsaou)
- Added ‘Real-Time Monitoring: The Netdata Standard’ document (#21012, #21015, #21016 @ktsaou)
- Fixed Mermaid diagrams across multiple files (#21011, @kanelatechnical)
- Added documentation for missing proc/stat options (#20997, #21001 @ilyam8)
- Documented accuracy implications of sampling algorithm (#20991, @ktsaou)
- Improved wording and fixed broken links in ‘Welcome to Netdata’ (#20986, @kanelatechnical)
- Improved ‘Parent Configuration Best Practices’ (#20984, @kanelatechnical)
- Improved collector documentation by grouping configuration options in tables for clearer navigation (#20980, #20987 @ilyam8)
- Improved go.d collector documentation with a clearer setup section and configuration comparison table (#20975, #20977, @ilyam8)
- Improved wording in ‘How to Delete Your Netdata Account’ (#20946, @kanelatechnical)
- Added documentation for account deletion process (#20927, @kanelatechnical)
- Clarified prerequisites in the NGINX collector documentation (#20924, @ilyam8)
- Updated billing documentation with instructions on restoring a plan after payment failure (#20910, @kanelatechnical)
- Fixed opt-out link in ‘Security and Privacy Design’ (#20909, @gatesry)
- Added ‘Function: Top / Processes’ document (#20902, @ktsaou)
- Fixed link to Netdata Cloud Demo Space (#20899, @andrewm4894)
- Updated Supported Linux Platforms and Versions (#20893, @BenjaminFosters)
- Improved alerting documentation with details on evaluation, automation, notifications, best practices, and status (#20891, @ktsaou)
- Improved exporting documentation clarity and structure (#20890, @kanelatechnical)
- Fixed metic names in windows.plugin metadata (#20864, #20865, @thiagoftsm)
- Updated logging documentation and added natural siem integration (#20829, @ktsaou)
- Added MariaDB 10.5.9+ SLAVE MONITOR privilege to the MySQL collector documentation (#20782, @ilyam8)
- Added UNIX socket access prerequisite to the Memcached collector documentation (#20780, @ilyam8)
- Added troubleshooting section to ‘AI and Machine Learning’ (#20772, @kanelatechnical)
- Added troubleshoot and custom investigations docs (#20759, @kanelatechnical)
- Added streaming routing documentation (#20743, @ktsaou)
- Removed ‘Customize the standard dashboard’ (#20742, @ilyam8)
- Added Network-connections to available functions (#20721, @ilyam8)
- Updated documentation for deployment strategy (#20712, @kanelatechnical)
- Fixed grammar in ‘Update Netdata’ (#20701, @kanelatechnical)
- Replaced legacy functions-table.md with comprehensive UI documentation (#20697, [#20699](https://github.com/netdata/netdata/pull/20699, @ktsaou)
- Added Getting Started Netdata guide (#20642, @kanelatechnical)
Other Notable Changes
Improvements
- Added network labels on Windows by detecting the default route interface IP and exposing it as a host label (#20938, @thiagoftsm)
- Added SIGNL4 alert notification method to Netdata Agent (#20911, @rons4)
- Implemented virtual host disconnection by detecting stale nodes, notifying Cloud, and dropping parent connections (#20860, #21040, @stelfrag)
- Added default network interface details to system info and host labels (#20767, @stelfrag)
- Added Ollama and DeepSeek support to MCP Web Chat, enabled multiple providers per endpoint, refreshed pricing, and fixed minor bugs (#20741, @ktsaou)
Other
- Reworked dbengine async wakeup on Windows to reduce excessive event loop notifications and added stale handle detection with automatic re-initialization (#21003, @stelfrag)
- Fixed compilation on on macOS 16+ (#20994, @ilyam8)
- Ensured proper memory ordering when updating the partition list and page availability bitmap to prevent race conditions (#20956, @stelfrag)
- Fixed Rocketchat notifications by adding the missing
Content-Type: application/jsonheader (#20954, @ilyam8) - Fixed use-after-free in the metric registry by deferring deletion until the last reference is released (#20947, @stelfrag)
- Fixed compilation on FreeBSD 14.2+ (#20944, #20955, @thiagoftsm)
- Replaced uv mutexes and condition variables with Netdata’s equivalents for cleaner code and consistent abstractions (#20941, @stelfrag)
- Fixed Windows sleep behavior by rounding durations to clock resolution, preventing sub-millisecond early-wake logs (#20887, @ktsaou)
- Added cargo lock file (#20855, @vkalintiris)
- Improved ACLK message parsing by simplifying request handling and removing unnecessary memory operations (#20838, @stelfrag)
- Switched MQTT statistics from spinlocks to atomics (#20836, @stelfrag)
- Adjusted MQTT buffer sizing with smarter defaults based on agent profiles for better performance (#20834, @stelfrag)
- Added metrics to monitor ACLK buffer usage (#20820, @stelfrag)
- Moved latency chart under the aclk online check (#20811, @stelfrag)
- Added monitoring for memory reclamation and buffer compaction in ACLK workers (#20810, @stelfrag)
- Updated SQLite to version 3.50.4 (#20791, @stelfrag)
- Renamed remaining uses of pthread_mutex_t and pthread_cond_t for consistency (#20746, @stelfrag)
- Removed redundant defines in MQTT client (#20744, @stelfrag)
- Fixed SNDR thread startup to ensure proper initialization (#20740, @stelfrag)
- Replaced pthread mutex/cond calls with Netdata’s synchronization primitives (#20737, @stelfrag)
- Cleaned up thread creation code (#20732, @stelfrag)
- Removed H2O web server code from Netdata (#20713, @Ferroin)
- Added a safeguard to ensure a chat exists before handling messages, preventing runtime errors in MCP web client app (#20700, @emmanuel-ferdman)
Deprecation notice
Changed in this release
SNMP Legacy Collection Disabled by Default
Manual custom OID configurations for SNMP are disabled by default.
If you still rely on them, you can temporarily re-enable legacy collection by setting disable_legacy_collection: no.
The hardcoded IF-MIB implementation has been removed. IF-MIB metrics are now supported exclusively through SNMP profiles.
Important Changes in Next Major Release
Deprecated Components
| Component Type | Versions Being Deprecated |
|---|---|
| APIs | v1, v2 |
What This Means
Only the v3 API and v3 Dashboard will be supported starting with the next major release. These newer versions offer improved performance, enhanced features, and better security.
Important Changes in Next Minor Release
SNMP Legacy Collection Removal
Manual custom OID configurations will be completely removed in the next minor release. Netdata will support only the profile-based collection method going forward.
Support options
As we grow, we stay committed to providing the best support ever seen from an open-source solution. Should you encounter an issue with any of the changes made in this release or any feature in the Netdata Agent, feel free to contact us through one of the following channels:
- Premium Support: Customers who wish to have a direct channel with Netdata and prioritized support with defined SLAs can contact us.
- Netdata Learn: Find documentation, guides, and reference material for monitoring and troubleshooting your systems with Netdata.
- GitHub Issues: Use the Netdata repository to report bugs or open a new feature request.
- GitHub Discussions: Join the conversation around the Netdata development process and be a part of it.
- Community Forums: Visit the Community Forums and contribute to the collaborative knowledge base.
- Discord Server: Jump into the Netdata Discord and hang out with like-minded sysadmins, DevOps, SREs, and other troubleshooters. More than 2000 engineers are already using it!